Liquidity Depth
How to read the liquidity depth
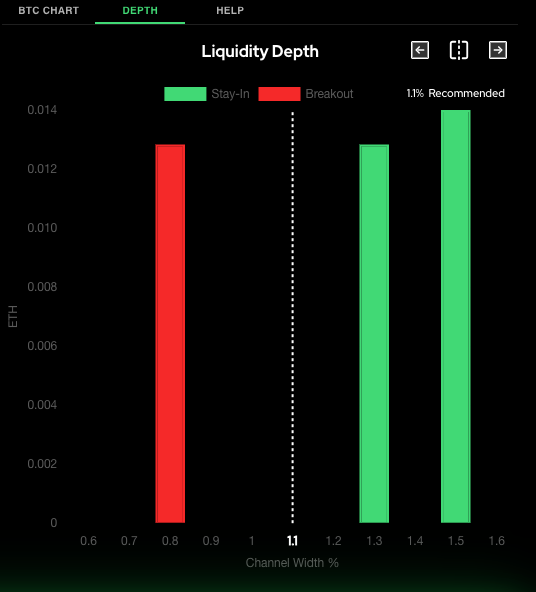
Recommended Price
In the center of the chart, you will see a dotted line that represents the current algorithmically determined range width, 1.1% above and below spot. This is the price that you should achieve a better chance at fast execution. To the right of the dotted line The right of the dotted line shows WIDER orders, these are typically STAY IN orders as they want to have the widest possible passage.
To the left of the dotted line
The left of the dotted line shows NARROWER orders, these are typically BREAKOUT orders as they want to have the narrowest possible passage.
Scrolling
At the top of the screen, you will see two arrows that allow you to scroll left and right to see the entire depth chart. By selecting the dotted line icon, you will recenter the chart.
Last updated